What can I view and analyse under the Group Performance Dashboard?
Under the Group Performance Dashboard in stayflexi, you can view and analyse the performance of your properties in detail:
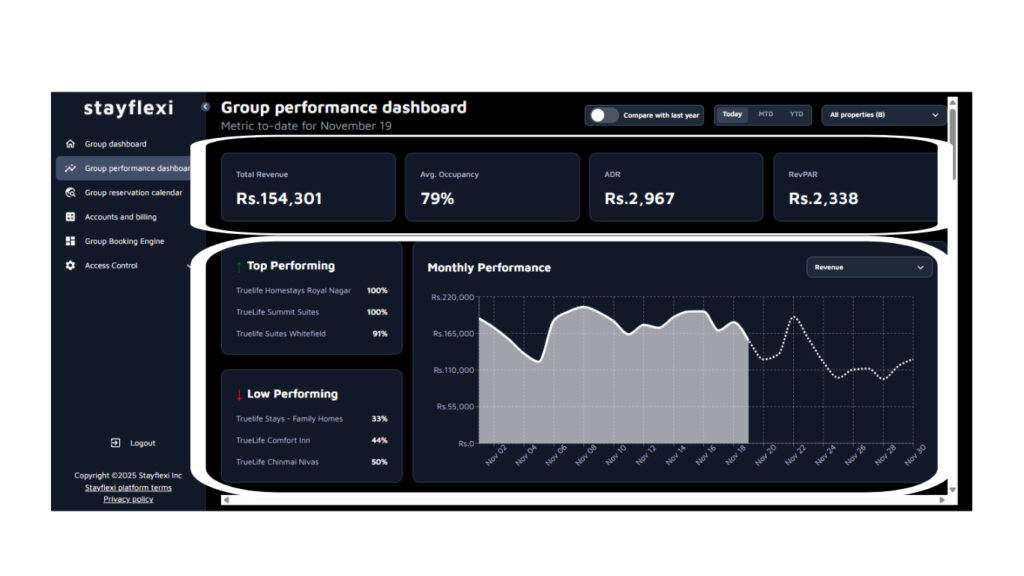
- Daily and Monthly Metrics: Instantly see key performance indicators like Revenue, Occupancy, ADR, and RevPAR for the current day or across a selected month.
- Top and Low Performing Properties: Identify which properties are leading or lagging through the panel on the left.
- Monthly Performance Trends: Use the interactive graph on the right to analyse trends over time, filtering by Revenue, ADR, RevPAR, or Occupancy.
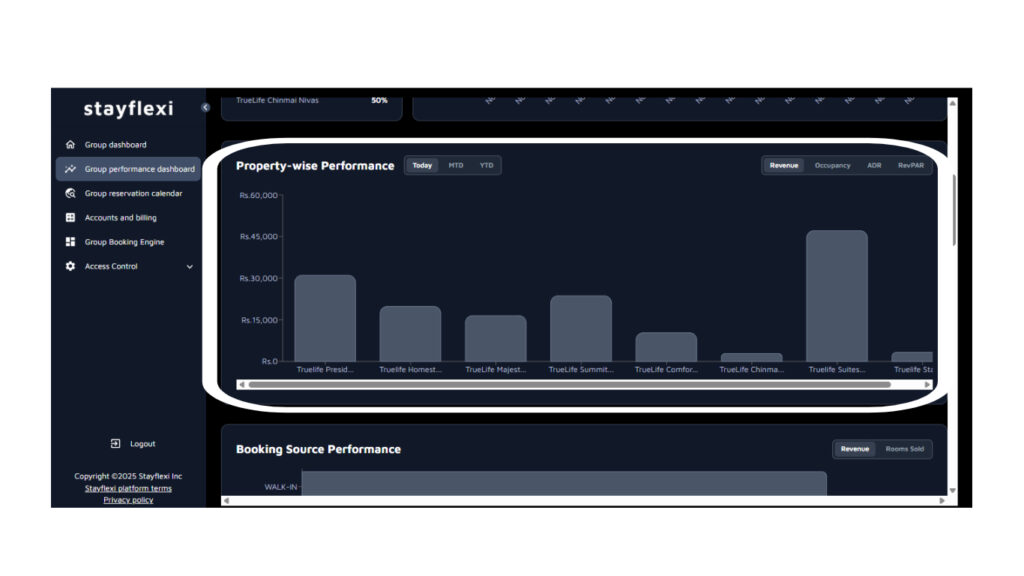
- Property-wise Performance: Compare properties with detailed bar graphs showing date-wise or monthly data for Revenue, ADR, RevPAR, and Occupancy.
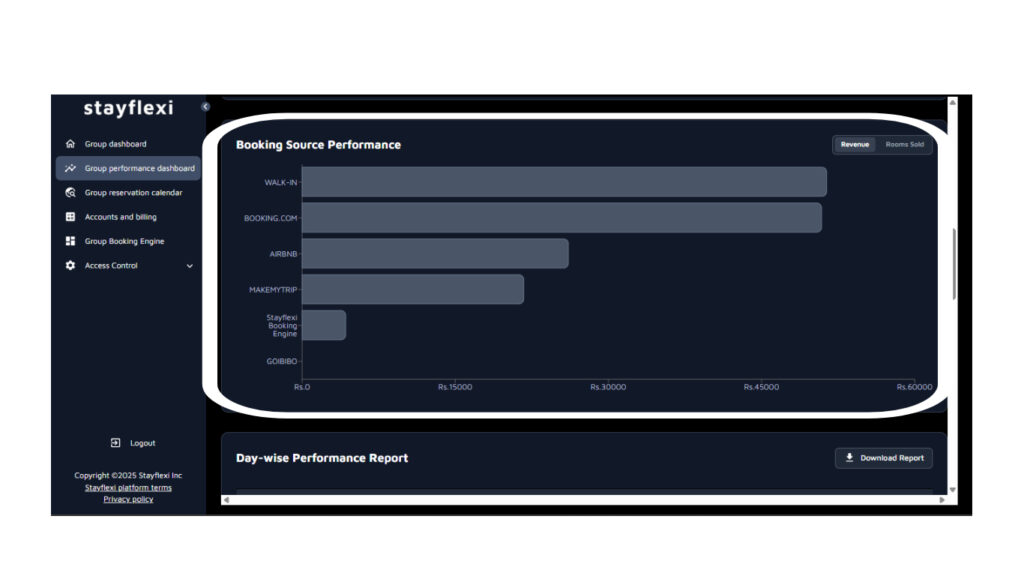
- Booking Source Performance: Review channel-wise performance using horizontal bar charts, filterable by Revenue or Rooms Sold.
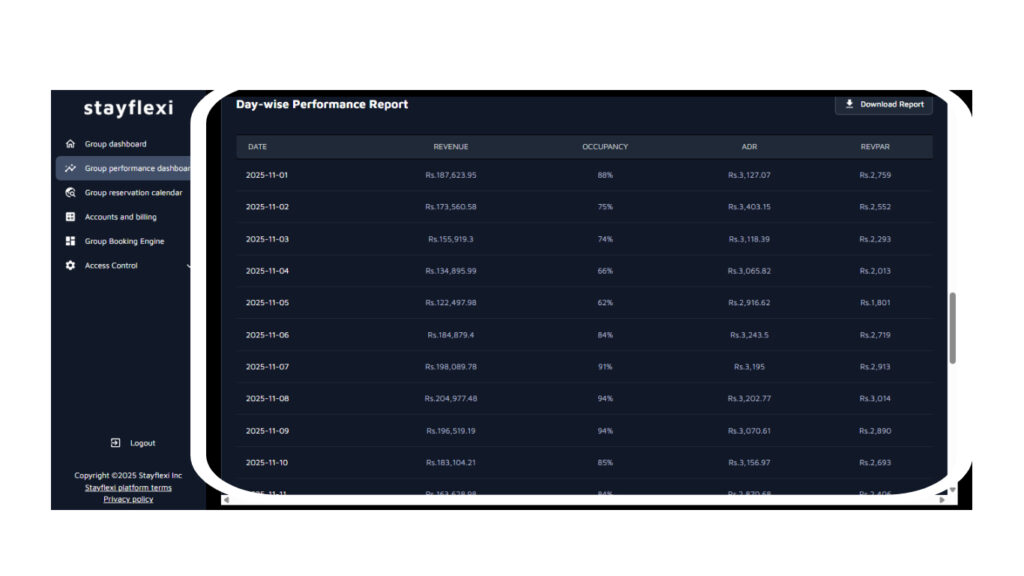
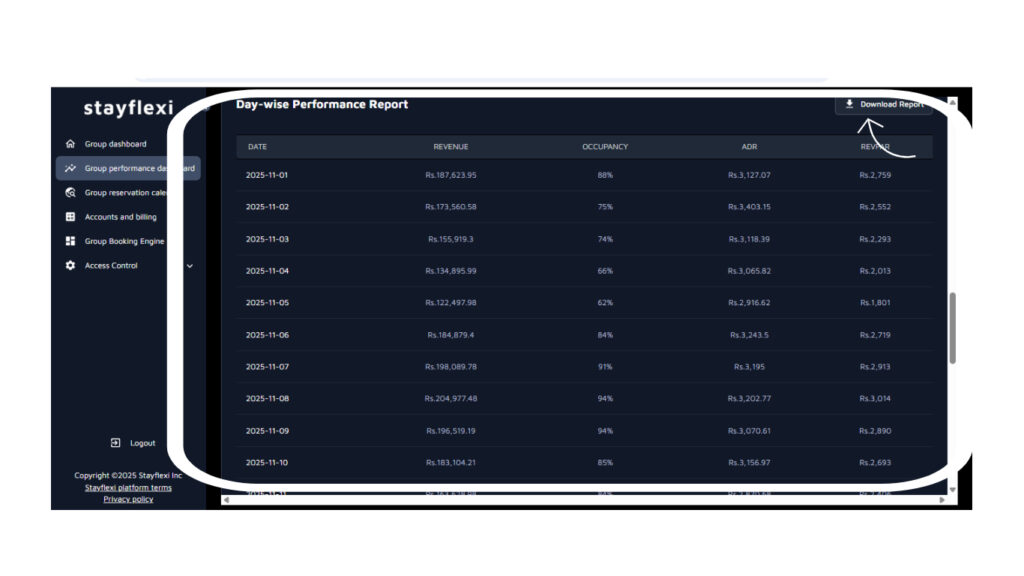
- Day-wise Performance Report: Access daily summaries of Revenue, ADR, Occupancy, and RevPAR, with the option to download reports for further analysis.
The dashboard provides a comprehensive view of your portfolio, enabling data-driven decisions to optimise performance and profitability.
